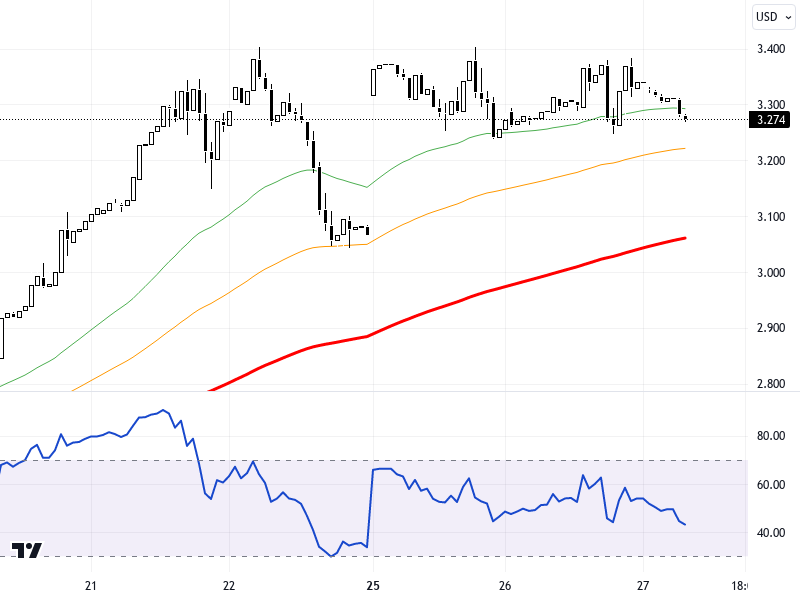
NGCUSD
U.S. natural gas futures, which initially rose due to cold weather forecasts, have returned to an unstable course following profit-taking. The performance of the European and U.S. stock markets and the inventory figures to be announced by the U.S. Energy Information Administration may play a significant role. While Asian markets are following a mixed course, key data such as PCE inflation and growth to be announced in the U.S. could be decisive regarding the direction of the markets. Ceasefire news between Israel and Hezbollah has also created a general stagnation in the markets.
Technically, the NGCUSD pair continues its fluctuation in the 3.400 – 3.465 range on the hourly chart. In downward movements, the levels of 3.4, 3.37, and 3.33 can be monitored as support, while in a possible upward recovery, resistance levels of 3.465, 3.5, and 3.535 should be followed carefully. The RSI indicator is displaying a negative outlook at the level of 34. The pair experienced a decline of 1.98% compared to the previous day and remains far from giving a clear signal regarding the trend's direction.
Support :
Resistance :


